


Last week, nearly 7,000 votes were submitted using the Voatz mobile voting platform in the Utah GOP’s virtual convention. This constituted a 93% turnout for the convention.
All submitted ballots undergo a public citizen’s post-election audit, in which anyone is able to participate as an auditor, hosted by the National Cybersecurity Center.
We wanted to share interesting data from this election. In addition to voting statistics, after voting, several Utah GOP voters voluntarily responded to a survey regarding their experience with mobile voting.
Highlights:
- 90% reported being “satisfied” or “very satisfied” with the convention
- 87% reported being more likely to serve as a delegate if future conventions are online
- 89% reported that their experience with Voatz was “positive” or “very positive”
- Only 13% prefer to return to a traditional, in-person convention
[Data from a UT GOP survey with nearly 1,000 respondents.]
Additional highlights:
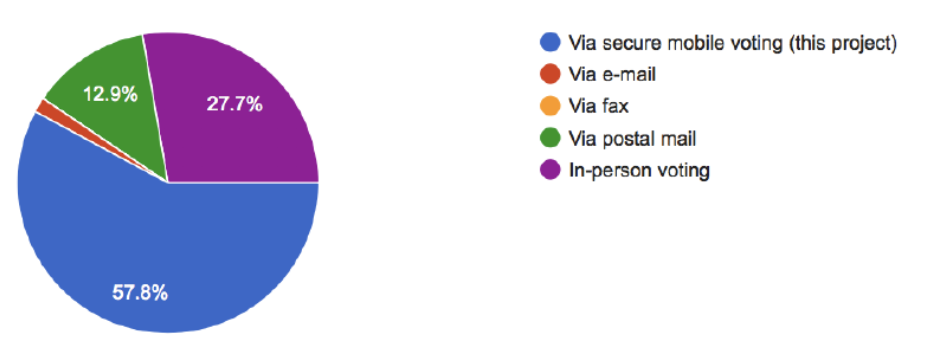
- A majority of the voters prefer submitting their ballot via secure mobile voting
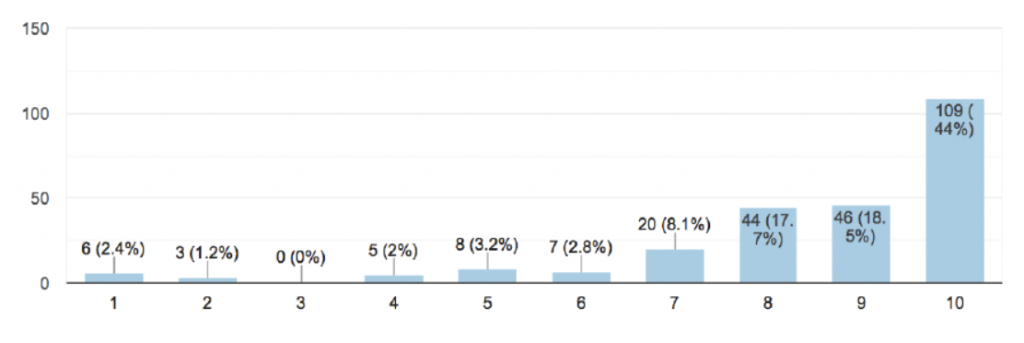
- Nearly two-thirds of the voters felt secure submitting their ballot via mobile voting
- Nearly all voters felt the instructions for completing verification were clear, that their ballot was easy to navigate and to cast
[Data from a voluntary survey specific to mobile voting with nearly 300 respondents.]
Below includes other highlights and data points from the election itself, as well as survey responses.
% RETURN RATE ON BALLOTS RECEIVED
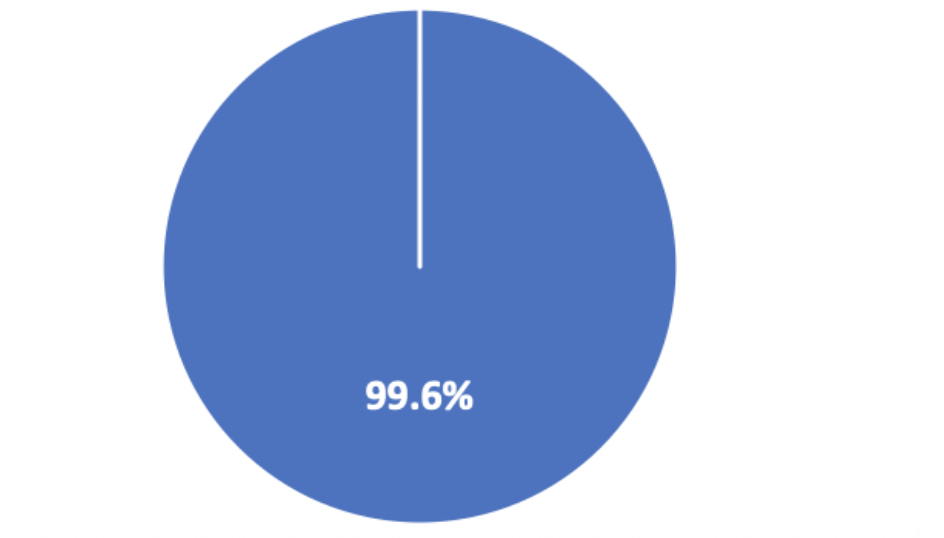
This means that 99.6% of delegates who successfully verified in the Voatz app and received their ballot successfully submitted it.
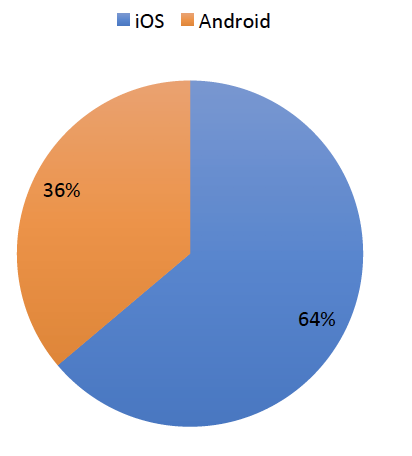
BREAKDOWN OF VOTER SMARTPHONE TYPE
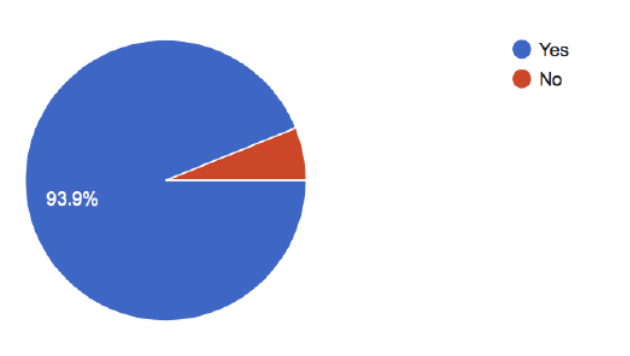
Q: Were the instructions for completing the verification clear?
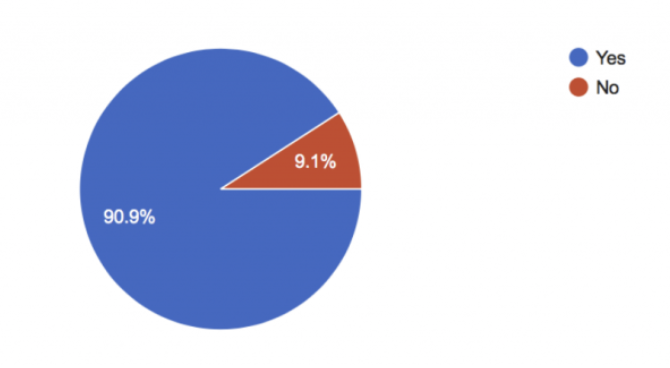
Q: Was the ballot easy to navigate?
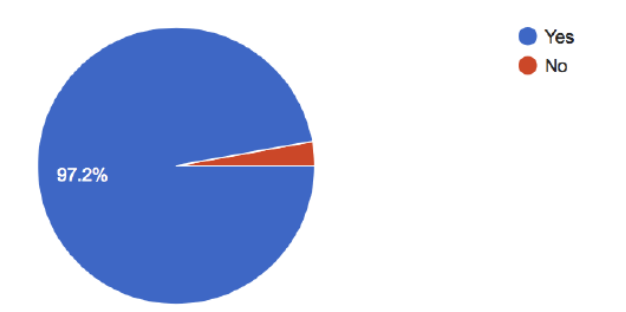
Q: Was it easy to cast/submit your ballot?
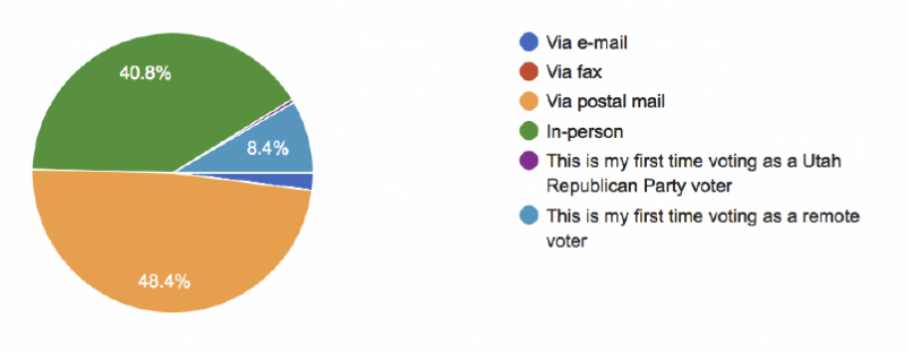
Q: How did you submit your last ballot, prior to this election?
Q: How secure did you feel submitting your ballot through this mobile voting project?
Q: What method do you prefer to submit your ballot?
State-of-the-Art Security Performs First-Rate Threat Mitigation
During the election, our advanced security threat detection mechanisms were able to detect, mitigate and thwart a handful of devices that had malware, were operating on insecure networks, or had insecure applications installed.
This is important data that indicates that the system is successful at ensuring a secure vote.
In these instances, voters were prevented from voting until the threat was mitigated. In some instances, voters were asked to remove malware on their devices and in others, some voters were asked to delete certain suspicious applications they had installed or remove certain appliances from their networks that could pose a threat to their smartphones.
Stay tuned for some more details in a forthcoming blog post.